What are equities?
In everyday investing, equities are also referred to as stocks or shares, and represent units of ownership in a company. They offer investors growth potential, can provide income through dividends, and can help protect against inflation. This guide explains how equities work and their role in your portfolio.
Authors:
Last updated: 13 August 2026
Guide to equities
In this guide you will learn what equities are and how they work. We will break down the potential benefits and trade-offs, the different roles they can play in an investor’s portfolio and dig into the different types of equities investors can use.
- Equities are sometimes referred to as the ‘growth engine’ in a diversified portfolio. While inherently riskier than some other asset classes (like investing in bonds), they offer potential for significant gains.
- A stock market (or exchange) is a marketplace where buyers and sellers trade shares of publicly listed companies.
- An index is designed to measure the performance of a particular basket of equities (or other security type) that represent a specific market or sector.
- Equities are often categorised according to characteristics such as company size, industry/sector or where the company is based. Understanding how equities are categorised can help you build a clearer picture of your portfolio.
A common question for newer investors is: “Are equities the same as stocks and shares?” The answer is broadly yes, in everyday investing (and in this guide), equities, shares and stocks are often used interchangeably.
Equities represent units of ownership in a company.
Investors buy shares to benefit from potential share price increases, to earn income through dividends (if the company pays them), or both. Because shareholders are partial owners, shares may also carry voting rights on certain matters (depending on the share class) and can give investors a say in aspects of how the company is run.
How do equities work?
Companies typically issue equity to investors to raise funds, often for growth projects, balance-sheet strengthening or other corporate purposes. When a company becomes listed on a stock exchange (such as the London Stock Exchange), members of the public can buy and sell its shares and become shareholders.
If the company issues new shares as part of the listing process (called a primary issue), it raises capital in exchange for selling ownership stakes, which typically dilute the holdings of anyone who already owns a share of the company (existing shareholders).
If it is the company’s first public sale of shares, the process is called an Initial Public Offering (IPO). This is often referred to in the UK as a ‘flotation’, after which the shares typically begin trading on the exchange. IPOs usually mean the company issues new shares, but can also include the sale of existing shares sold by early investors/founders.
Companies can also be bought and sold without being listed on an exchange. Investments in unlisted companies – often made via specialised private equity funds – are generally referred to as private equity, which is considered a distinct asset class from publicly traded equities. In this guide we focus exclusively on publicly traded equity.
When a company sells newly issued shares in an IPO, investors are buying in the ‘primary market’. Once the company is listed and trading, investors who buy or sell shares generally do so in the 'secondary market'.
Leading global stock exchanges
A stock market (or exchange) is a marketplace where buyers and sellers trade shares of publicly listed companies. Share prices fluctuate depending on supply and demand, which is determined by investors' assessment of a company’s prospects.
- New York Stock Exchange, US (NYSE)
- National Association of Securities Dealers Automated Quotations, US (NASDAQ)
- Shanghai Stock Exchange, China (SSE)
- Euronext, Pan-European (ENX)
- Tokyo Stock Exchange, Japan (TSE)
- London Stock Exchange, UK (LSE)
Note: A stock exchange is not the same thing as an index, which we explain later.
Why do equities matter?
Equities play a fundamental role in supporting economic growth.
In total, the value of global equity markets is well in excess of $150 trillion (as of July 2026).
Equity issuance raises capital by selling ownership stakes of companies, which can allow the company to fund expansion, invest in innovative technologies, and/or attract and develop talent. The process of raising capital in an IPO can allow companies to expand much more rapidly than by relying solely on rising sales over time.
Stock markets can act as a barometer of economic health, reflecting collective expectations about future growth of a company, sector or country. The growth of pension funds and retirement savings often relies heavily on equity returns, meaning market performance can have a real world impact for the consumers that rely on them, and even affect living standards.
“Equities serve as a reflection of the economic growth of a company, or even a country, and can allow investors to tap into that potential. With some good habits, such as aligning your portfolio to your investment horizon, focusing on diversification, and looking at a holistic picture of a portfolio, equity investors can benefit from strong potential rewards that can balance the risks involved.”
Portfolio Manager, Bola Onifade
What is the role of equities in a portfolio?
Investors typically hold equities for:
- Growth potential – especially over the long term
- Income potential – some companies pay regular dividends
- Inflation protection – equity investment returns have often outpaced inflation (but can still fall or lag inflation)
Equities are sometimes referred to as the ‘growth engine’ in a diversified portfolio. While inherently riskier than some other asset classes (like investing in bonds), they offer potential for significant gains. If an investor buys a share at a lower price and sells it when the price has risen, they can secure a ‘capital gain’, or profit.
Note: Gains on investments, and any income generated from them may be subject to tax.
Share prices can be volatile, meaning the value of your equities can fluctuate due to company performance, market sentiment, and broader economic factors. There is also the risk of losing part, or all, of the invested capital – particularly with individual stock positions.
Below is an illustration of how historic returns of various asset classes compare with historic risk (as measured by price volatility). Volatility is a measure of how much prices move around within a given period of time. The chart below compares return and volatility of various asset classes since 2004. Global equities have exhibited the highest return of the assets compared, with the highest level of risk, or volatility.
Provided investors understand the characteristics of equities, they can be a powerful tool when seeking long-term growth.
Asset class risk-return trade-off
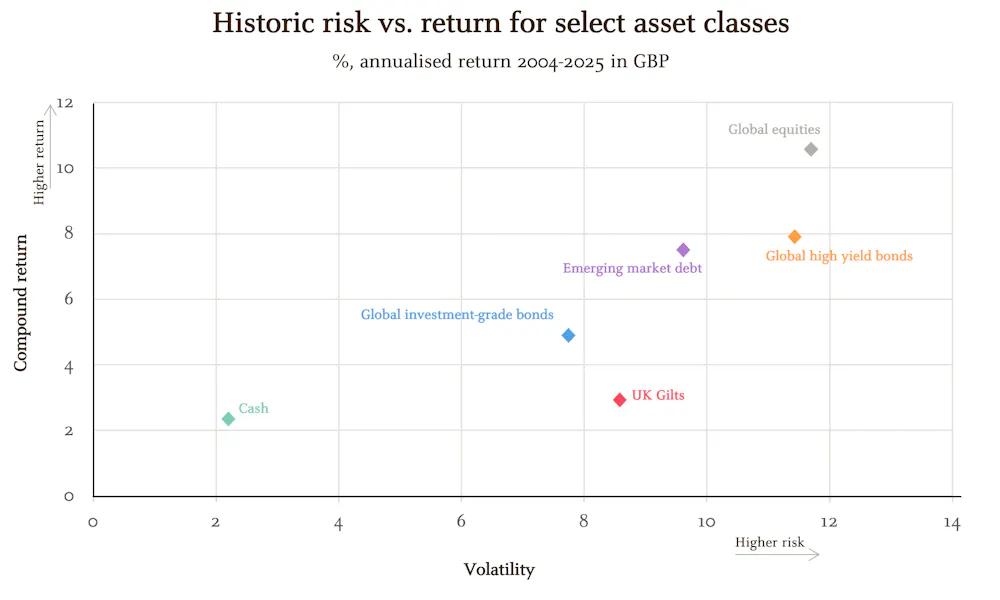
Source: Bloomberg, LSEG Datastream, MSCI, J.P. Morgan Asset Management. Volatility is the standard deviation of annual returns since 2004. Cash: J.P. Morgan Cash United Kingdom (3M); UK Gilts: Bloomberg Sterling Gilts; Global investment-grade bonds: Bloomberg Global Aggregate – Corporate; Emerging market debt: J.P. Morgan EMBI Global Diversified; Global high yield bonds: ICE BofA Global High Yield; Global equities: MSCI All-Country World Index (includes developed and emerging markets). Past performance is not a reliable indicator of current and future results. Guide to the Markets – UK.
Data as of 31 December 2025. Annualised returns reflect the average return of an asset class expressed as a yearly rate. Guide to the Markets – UK. LV–JPM57517 | 01/26 | UK | 682c09e0-5585-11eb-9ed0-eeee0affa179
This chart compares global equities with a few categories of bonds. You can read our guide to bonds to find out more about how they work.
How much equity should you have in your portfolio?
The right proportion of equity in a portfolio depends on the investor. Equities play a significant role in most investment portfolios. They can serve as an inflation hedge, help to generate income, offer flexibility and diversification, aid in managing risk and volatility, all while serving as a growth engine.
Understanding equities and how they can behave is important for investors deciding what proportion of a portfolio they want to dedicate to them. Because equities are versatile, they can be useful for almost all investors to some extent. The proportion that a 60-year old considering retirement has allocated to equities may be very different from the allocation a 30-year old has, for example.
An investor’s capacity for and tolerance to risk, and whether they are primarily seeking growth or income, can determine both the proportion of a portfolio that is allocated to equities, and the type of equities bought. As a rule of thumb, investors with a higher tolerance for risk tend to allocate more of their portfolio to equities than they might to traditionally less-risky asset classes (like bonds). If you are more risk averse as an investor, bonds may make up more of your portfolio. Remember, investing may not be appropriate unless you have an investment horizon of at least 3 years.
What is a market index?
An index is designed to measure the performance of a particular basket of equities (or other security type) that represent a specific market or sector. Different indices serve different categories and purposes.
On the London Stock Exchange (LSE) for example, there are several key indices. The FTSE 100 index measures the movement of the 100 largest companies (by market capitalisation) listed on the London Stock Exchange. FTSE 250 follows the next largest 250 UK companies outside of the FTSE 100. The FTSE All-Share is an aggregation of the FTSE 100, FTSE 250 and smaller companies listed on the LSE main market that meet rules around size and trading liquidity (how frequently and how many shares are traded). The FTSE All-Share captures ~98% of the UK’s market capitalisation.
The S&P 500 is commonly used as an indicator of US equity performance, and follows US large-cap companies (we explain market capitalisation in detail further below). The MSCI All Country World index is often used to follow global equities across advanced economies (such as the US, UK, Germany and Japan) and emerging economies (such as China, India and Brazil).
Indices can also measure a particular sector’s performance, or a specific region, and many measure asset classes other than equities.
How can I invest in equities?
Collectives versus direct equities
Investors can either buy and sell individual equities (direct equities), or build equity exposure through collective investments (collectives), or a combination of both.
Individual stocks can be rewarding to research, but typically require more initial and ongoing work. Single-stock holdings can also increase concentration risk, which is one reason some investors prefer diversified funds (especially as they start out).
Collectives are ‘pooled vehicles’, meaning investor funds are pooled and used to build a portfolio which the investors proportionally own. Collectives can refer to a variety of investment products, but common structures include exchange traded funds (ETFs), investment trusts and open ended investment companies (OEICs). Each vehicle structure has its own merits and drawbacks, and investors may use a combination when building a portfolio.
- Exchange traded funds are not themselves company equities, but are fund structures that may hold a basket of equities (or other assets). ETFs have grown in popularity in recent years, and are a popular choice with investors seeking to gain exposure to an entire index. ETFs can either be passive – designed to track an index or basket of shares automatically – or active. Active ETFs typically have an investment professional making decisions about the portfolio. Both active and passive ETFs can offer cost effective methods of building diversified exposure to financial markets. ETFs trade on an exchange, hence the name. The J.P. Morgan Personal Investing Managed Portfolios are built primarily with ETFs.
- Investment trusts are listed investment vehicles. An investment trust represents a portfolio of managed investments, structured as a listed company, that can be bought and sold on an exchange like a share.
- OEICs Open ended investment companies also offer investors access to a diversified portfolio of securities, but do not trade on an exchange. Instead, the OEIC can expand if more investors want to buy the fund by creating new shares, or it can reduce the number of shares if investors want to sell. OEICs are also typically actively managed. Internationally, OEICs might be referred to as ‘mutual funds’.
Categorisation of equities
Equities are often categorised according to characteristics such as company size, industry/sector or where the company is based.
Understanding some of the ways equities are categorised can help you build a clearer picture of your portfolio and the types of risks you may be exposed to, or about to take on.
Below are some common equity categorisations.
Market capitalisation
Market capitalisation or 'market cap' represents the total market value of a firm’s outstanding shares.
Listed companies are commonly split into three size categories:
- Large-cap equities: Large-cap equities comprise the biggest companies traded on a given stock exchange.
Large-cap equities are often, although not always, more mature firms. As a consequence, they are often expected to offer greater stability than small, less established companies. The FTSE 100 is the UK’s large-cap index. The average market cap of the FTSE 100 is around £24 billion (as of June 2026). The S&P 500 is the US' most widely referenced large-cap index. Large cap equities are often more ‘liquid’, meaning it is usually easy to find a buyer or seller of the security and/or to trade larger orders.
- Mid-cap equities: Between large-cap and small-cap firms sit the mid-caps.
These firms are often characterised by rapid growth and expansion potential, with higher volatility relative to large caps. Liquidity is not typically as high as large-cap equities.
The FTSE 250 is considered the UK’s mid-cap index. The average market cap for a FTSE 250 company is around £1 billion (as of June 2026).
- Small-cap equities: Small-cap companies are often younger, less established firms.
Small-cap equities are generally considered to be highly volatile. Small-caps can be significantly less liquid, which means they can be more difficult to buy and sell than large-cap or mid-cap equities.
Geographic focus and regional diversification
Equities may be categorised by their geographic location, allowing investors to tailor portfolios to specific regions or diversify internationally.
Geographic categorisation may be by specific country (such as US equities, Chinese equities or Japanese equities), region (such as European equities, Asian equities), or economic maturity (typically developed markets vs emerging markets).
Investing internationally can enhance portfolio diversification and growth potential. Investing in different regions can introduce unique risks, such as currency fluctuations, political instability, and different regulatory standards, but investors can also access some investment themes unavailable through domestic investment alone.
It is important that investors also know that geographic location and geographic exposure are different. If a company derives a significant portion of its earnings from overseas markets, this can diminish the significance of company domicile (where it is registered as a legal entity). As an illustration, the companies in the FTSE 100 derive the majority of their sales from overseas, with a range of estimates putting the figure at around 75% or more.
Different geographies often offer differing sector profiles. Not all countries are equally exposed to the same industries. The US S&P 500 index for example, has a very different sector split to the FTSE 100.
Sector breakdown – S&P 500 and FTSE 100
Sector (GICS)* | S&P 500 | FTSE 100 |
|---|---|---|
Financials | 12.7 | 27.1 |
Consumer Staples | 4.9 | 14.2 |
Industrials | 8.7 | 13.7 |
Health care | 9.5 | 12.2 |
Energy | 3.4 | 10.7 |
Materials | 1.9 | 7.7 |
Consumer discretionary | 8.9 | 4.5 |
Utilities | 2.2 | 4.4 |
Communication services | 9.8 | 2.0 |
Real Estate | 2.0 | 1.2 |
Information technology | 36.0 | 1.0 |
Other | - | 1.4 |
Source: Bloomberg, J.P. Morgan Personal Investing, as at July 2026. *Global Industry Classification Standard. Subject to change. Numbers may not total 100% due to rounding effects.
What are developed market equities and emerging market equities?
Developed market equities are shares in companies based in what are considered to be more advanced economies, with mature capital markets. Developed markets tend to offer more stability, liquidity and transparency to investors. The UK is considered a developed market along with peers such as (but not exclusive to) the US, Germany, Japan and Australia.
Emerging market equities are shares in companies based in developing nations that are in the process of growing and integrating into the global market. Emerging markets can exhibit phases of rapid GDP growth and increased foreign investment. As emerging economies develop, the population may experience a transition from a low to higher income, as the country modernises. Whether a country is classed as ‘developed’ or ‘emerging’ can vary by index provider. At time of writing, for example, South Korea is classified by FTSE as a “Developed country” but by MSCI as an “Emerging country”. It pays to double check.
However, investors should be aware that emerging economies can be less stable as they seek growth. The regulatory environments may be less stringent, there may be greater political instability and domestic currencies can exhibit greater fluctuations than developed market equivalents. India, Brazil and China are considered examples of emerging markets. That said, countries such as South Korea and Taiwan – also typically categorised as emerging markets – are home to semiconductor companies that are playing a central role in the supply chain for artificial intelligence (AI) firms, meaning the region is increasingly driven by tech-related developments.
What is the difference between growth and value investing?
Equities can also be classified according to qualities that investors believe may shape their future behaviour.
Some investors exhibit a preference for so-called ‘growth’, while others find ‘value’ shares more appealing. In reality, most diversified portfolios will have exposure to both.
Valuations play a key role in growth and value investing. These can be calculated many ways, but often refer to the price an investor has paid per share as a multiple of the company’s earnings per share (the company’s net income, divided by outstanding company shares). This is also known as the price-earnings or ‘P/E’ ratio.
What is growth investing?
Growth investing involves identifying companies that investors expect to deliver above-average growth compared to the rest of the market over the long term. Growth companies may carry higher valuations, as measured by P/E ratios, but can also deliver stronger earnings growth.
Growth companies are often ‘disruptive innovators’, and tend to reinvest profits to fuel expansion rather than paying out dividends. While these shares may offer a significant amount of growth potential, they can also display greater share price volatility.
What is value investing?
Value investors seek companies that they consider to be trading at a price which is lower than the company’s intrinsic worth (in their opinion). An investor may arrive at what they see as the ‘true value’ using one or several metrics, including the company’s dividend, earnings or sales, compared to the stock’s current market price.
Value investors may seek examples of what they believe to be ‘temporary setbacks’, or declines in a company share price that they do not feel fairly reflect the quality of the underlying business.
Value investors believe in their ability to find companies they see as ‘undervalued’. They will then typically hold those investments until the market’s view on them changes for the better and the share price more accurately reflects what they deem to be the company’s true worth.
What is dividend investing?
Dividend investing is an important component of a traditional income investing strategy. Dividend investing involves selecting equities that pay regular dividends, providing investors with an income stream in addition to potential capital gains.
Dividends are typically paid by established, profitable companies and can be distributed quarterly, semi-annually, or annually.
Dividend-paying equities can potentially enhance portfolio stability, provide passive income, and can often help offset market volatility. Reinvesting dividends can further compound returns over time. Note that most dividends are paid by companies on a discretionary basis, which means they can increase, decrease or stop, if the company management believes it is in the interests of the company to do so.
Equities compared with other asset classes
Equities can be a valuable tool for building long-term wealth, but they’re not the only tool investors have.
Below is an illustration of how equities can be compared to other asset classes, to help you to understand how much equity exposure might be appropriate for you. Risk and return vary a lot within each asset class. Not all of the below asset classes are currently investable with J.P. Morgan Personal Investing.
Asset Class | Characteristics | Risk Level | Return Potential | Liquidity | Income Potential | Volatility | Primary role in a Portfolio |
|---|---|---|---|---|---|---|---|
Equities | Shares in listed companies offering potential for long-term capital growth. | Medium-High | High | High | Dividends | High | Growth |
Bonds (Fixed Income) | Debt securities are often used to provide regular income, and are typically less risky than equities. | Low-Medium | Low-Medium | Medium-High | Interest/Coupons | Low-Medium | Income and stability |
Cash | Cash or 'highly liquid' (easy to buy and sell) assets such as savings and money market funds. Typically offer minimal risk and low return. | Very Low | Very Low | Very High | Interest | Very Low | Liquidity |
Real Estate | Physical property or property funds offering income and potential for long-term capital appreciation. Real estate can also fall under ‘alternatives’. | Medium | Medium | Low-Medium | Rent | Medium | Income and diversification |
Commodities | Physical goods like gold or oil, often used for diversification and inflation protection. | High | High | Medium | None | High | Diversification |
Alternatives | Broad categorisation referring to non-traditional assets (e.g., private equity, hedge funds, collectibles) with unique risk-return profiles. Typically harder to access for the average investor. | Medium-High | Medium-High | Low | Varies | Medium-High | Diversification |
Foreign currency (cash or short-term securities) | Cash deposits or short-term securities (money market funds) denominated in a foreign currency; value fluctuates vs home currency | Low-Medium (low in local terms; higher once FX considered) | Low | High-Very High | Interest (foreign short-term rates) | Low-Medium (local); Medium in home currency due to FX) | Liquidity and diversification |
Cryptocurrencies | Digital assets with high volatility and potential for rapid gains or losses. | Very High | Very High | Variable | None | Very High | High risk/reward |
Source: J.P. Morgan Personal Investing, for illustration only. This is not an investment recommendation. Always do your own research.
Risk warning
As with all investing, your capital is at risk. The value of your portfolio can go down or up and you may get back less than you invest.
Past performance and forecasts are not a reliable indicator of future performance. We do not provide investment advice in this guide. Always do your own research.
This article may reference products and services which JPM PI does not currently offer.