Global Diversification: Why all investors should understand their portfolio’s geographic exposure
A beginner’s guide to global diversification: what it means, why it matters, and how investors can use it to build a more robust portfolio.
Authors:
Andrew Lacey | Navisha Joshi
Last updated: 19 November 2026
Guide to global diversification
Diversification is a core concept in investing, and one of our seven key investment principles.
Properly diversified, a portfolio can be more resilient to sudden market movements than one that is concentrated in one (or a few) asset classes, sectors or geographic regions.
In this guide, we look specifically through the geographic lens of portfolio diversification:
- Learn about the concept of global diversification and how it can improve portfolio resilience
- Get familiar with some important considerations when allocating across regions or countries
- Understand why investments might behave differently depending on where a company operates and where its earnings come from (not always the same)
- Compare and contrast different investable regions/countries to become more comfortable with your portfolio’s geographic allocation.
The guide will focus on equities, but much of what you will learn can be applied to bonds as well.
What is a globally diversified portfolio?
Global diversification seeks to reduce portfolio reliance on the economic performance of a single country or region.
A globally diversified portfolio, with holdings spread across a number of countries or regions, can also widen the available range of investment opportunities.
For example: If an investor is based in the UK, and their portfolio comprises only equities or bonds issued by companies that operate in the UK, their portfolio may be highly dependent on the performance of UK financial markets.
The importance of how globally diversified a portfolio is will differ according to the investor, but all investors should understand and be comfortable with their geographic split. The assessment of geographic exposure typically has both economic and market components, which we look at below.
Crucially, investors may hear the terms ‘market’ and ‘index’ used interchangeably, but there are differences.
- A market is the broader investable universe in which assets trade and where prices are set (it includes many companies, sectors, and types of securities).
- An index is constructed with a specific purpose – generally it is a specific list of securities, created using a calculation method, and designed to represent a part (which may indeed be the majority) of a market.
An index can often be used as a proxy (a measure, or rough ‘stand in’) for a market, and different indices can tell different stories about the ‘same’ market depending on what they include and how they’re weighted.
Why regions and countries perform differently
Each country and regional bloc economy (e.g., Europe) is different (setting aside for now more granular local perspectives and broader international ones).
Economies differ according to a range of factors including, but not limited to:
- Economic cycles – An economic cycle refers to phases of economic growth (or ‘expansion') and slowdown (or 'contraction/recession') over time. Economies do not grow constantly or consistently. It is normal for economies to experience bouts of stronger growth, weaker growth, or recession (shrinking), before a subsequent recovery phase or expansion typically begins the cycle again. All of these phases can last months or years. Even if the global economy is expanding, where an economy is in its economic cycle can vary significantly between countries and regions.
- Policy responses – In this context, policy (or policy response) refers mostly to the combination of monetary or fiscal policy. These are the main response mechanisms a government and/or central bank have to manage an economy. Monetary policy generally covers central bank changes to interest rates and how readily money can move through its financial system (for example, via lending), and it is often used to steer inflation and growth. Fiscal policy generally refers to government spending and taxes, and it can help to steer demand, create jobs, and stimulate growth. Policy approaches can differ a lot from one country to another, as they can between elected governments in democratic countries.
- Different industry sector compositions – Each economy will be driven by a different blend of industries, commonly categorised into industry sectors (what investors usually mean by ‘sectors’). Much as a portfolio may be more resilient if it has numerous differentiated return sources, an economy can be more resilient if it is less reliant on one or a small number of industries to support its growth. In general, the prospects for an economy will be most impacted by the fortunes of its most dominant industries. When considering geographic allocation in a portfolio, investors should understand how its stability may be affected by the success or failure of its major industries.
- Concentration management – Global diversification can broaden the opportunity set available to an investor. This is linked to the point above on sector compositions; some markets and sectors are easier to access when investing in other countries. However, some markets can also be very concentrated, meaning in this case that a significant proportion of the investable universe may comprise companies that operate within the same or similar sectors. We explain this in more detail below.
- Currency diversification – Currencies move relative to one another constantly, and currency movements can have a significant, sometimes overlooked impact on portfolio returns. Global diversification in a portfolio can help to diversify exposure to one or a small number of currencies, although investors should be mindful of the potential impact of adding exposure to another currency. Some currencies have historically been more stable – some even sought by investors during bouts of heightened uncertainty – others have been more volatile. How a currency is managed by the government or central bank, and how it has performed in the past – while not a guarantee of future performance – should be considered.
How to compare investment regions: 4 key factors
Whether you invest directly in individual equities or bonds, or choose to add broader geographical exposure via a collective investment, investors may want to consider how the position might affect their portfolio’s overall risk profile. Building up an understanding of a region’s characteristics can help to determine the size of an allocation.
1. Index composition and sector tilt
Many investors gain exposure to a particular country or region using ETFs that seek to replicate the performance of an underlying index. In most cases, there are numerous indices investors can choose from for each region/country. If taking this approach, it can be valuable for investors to understand the sector composition of the index, as it can vary significantly.
For example, the US' S&P 500 index is frequently cited when investors are discussing broader US equity market performance. Other equity indices may be referenced for tracking more specific parts of the US equity market. The Nasdaq 100 index (NASDAQ) is heavily dominated by leading US tech companies. The Russell 2000 focuses specifically on US smaller companies, which are not reflected in the S&P 500. However, the S&P 500 index covers over 80% of total US market capitalisation, and is considered to offer a broad ‘cross–section’ of US equities.
In recent years, the S&P 500 has been heavily tilted towards tech and ‘tech-adjacent' names. Tech-adjacent refers to companies that sit in other industrial sectors, but in other respects might be considered to behave like tech companies. As a result, an investor's effective exposure to the tech/growth ecosystem may be bigger than the single 'information technology’ sector (as it is commonly referred to) may suggest, because some of the most influential 'tech-like' businesses are categorised differently. The S&P 500 also has meaningful exposure to financials and health care.
By comparison, the UK market is less tech-heavy than the US, and tends to have meaningful exposure to financials (banks, insurers), energy (large integrated oil & gas can be influential), materials (global miners can be large index weights) and consumer staples (often owners of large global ‘household’ brands).
Investment products that offer exposure to emerging markets are also common, but these can often combine exposures to very different countries. Some of them may have deep markets (generally comprising large, more easily-traded companies in a range of sectors – explained below) and stable regulatory frameworks. Others may have ‘shallower’ markets and higher political/currency risk (more below). Additionally, some country exposures might be highly concentrated into specific sectors. For example, as of August 2026, the MSCI Korea has a weighting to tech in excess of 70% (of which the majority is made up of only two companies).
It’s important to remember that industry/sector weights can shift over time, as can other characteristics we may touch on.
2. Size and maturity of capital markets
The size and maturity of a market can have a number of implications for an investor’s decision to enter it, and at what size.
Bigger, more mature markets usually let you trade large amounts more easily, with tighter bid-offer spreads and less price impact. Sometimes referred to as ‘deep’ markets, they generally have lots of participants and research coverage, and prices tend to incorporate information that can move prices more quickly. Investors may therefore consider prices to be more reflective of the most up-to-date information.
Smaller/less mature markets, on the other hand, can be harder and more expensive to enter/exit. In less mature markets, it is possible that prices have not adjusted to all information. Mature markets may have higher disclosure standards and accounting norms, and more rigorous enforcement of breaches of standards or laws than might be the case in less mature markets.
US capital markets – its combined equity and bond markets – are the largest in the world. The scale of these markets means the US has an enormous influence on portfolios around the world. The UK, Europe and Japan also typically have large and mature capital markets (albeit that Europe has a mix of so-called ‘core' and 'peripheral' economies, which behave differently in times of market stress). China’s equity markets are large, but are split into two; an onshore 'A-share' market and offshore 'B-share' market. The A-Share market in particular can be more difficult for UK investors to access.
3. Currency
Currency can enhance or detract from portfolio returns to a significant degree, yet is often overlooked by investors. The stability of the currency in a target investment market can therefore have a bearing on the size of a portfolio position in a given geographic area (or indeed if the position is taken at all).
The US dollar (USD) is the most widely held currency in official foreign exchange reserves, according to the International Monetary Fund (IMF), and used extensively in the pricing of international trade (including commodities). This is why it is often referred to as the world’s ‘reserve currency’. Additionally, the US government bond market (Treasury market) is extremely large, and Treasuries themselves are generally easy to buy and sell (liquid). Overall, the dollar is insinuated deeply into the global financial system, and as a consequence, is generally a comparatively stable global currency during bouts of market stress.
Reserve currency status tends to make the USD more resilient in crises, but it doesn’t mean the dollar can’t have long up-and-down cycles – multi‑year periods when it strengthens or weakens against other currencies – often due to shifts in economic conditions or policy.
Emerging market currencies are, on the other hand, typically much less stable. Indeed, dollar strength can adversely impact emerging market economies for several reasons. A number of emerging market countries borrow money (sell bonds) denominated in US dollars. A stronger US dollar can make the local currency amount needed to pay the interest on the bonds go up. A stronger dollar can also increase the cost of imported goods priced in US dollars, such as oil and other important commodities.
4. Policy and regulatory backdrop
In countries with a stronger history of robust policy and regulation – like the US, UK, and Japan – investors may have higher overall confidence in the enforcement of law and disclosure standards etc.
Risks tend to be more about shifts made in established policy, such as rate changes, or taxation regulation. In countries with weaker – or less predictable – regulatory or policy environments, policy can change quickly and be implemented decisively. ‘Policy risk’ can however, also rise and fall in more stable markets, particularly when political instability or macroeconomic uncertainty erode the policy maker capacity to act with confidence.
Historical regional performance: explaining volatility, drawdown and Sharpe ratio
Here we look at key indices representing the equity markets of major investable geographies. We illustrate how they have behaved in the past decade, with the comparison anchored by four main figures.
Financial markets can be unpredictable, particularly in the short term. Past performance is also not a reliable indicator of future return. The below is for illustration purposes only.
- Compound Annual Growth Rate (CAGR) – The average yearly growth rate of an investment that assumes a steady growth rate and that all gains were reinvested. It smooths out the ups and downs of different years, to give a single annualised return figure over a period (e.g., 10 years). It’s useful for comparing growth over different timeframes, but it doesn’t show volatility or the size of interim losses.
- Annualised volatility – A measure of how much an investment’s returns have tended to fluctuate, shown as a % per year. Higher volatility means returns have been more variable (a bumpier ride), and it’s often calculated from daily/monthly returns then converted into an annual figure.
- Sharpe ratio – A 'return vs risk' measure showing how much extra return above a low‑risk rate (often this reference rate will be cash or short‑dated UK government bonds) an investment delivered per unit of volatility. In a nutshell, it shows if an investor has been compensated for taking additional risk. Higher is generally better; as a rough rule, above 1 is often seen as strong, but results depend on the timeframe and assumptions used.
- Maximum drawdown – The largest peak‑to‑trough fall in an investment’s value over a chosen period (e.g., falling from £100 to £70 is a ‑30% drawdown). A larger (more negative) drawdown means a bigger historical drop, and typically requires greater willingness/ability to stay invested during declines.
The indices in the table below have been selected for reputation, breadth of coverage and/or for comparability of performance data.
Country/region | Example index | CAGR (%, 10-year rolling) | Annualised Volatility (%) | Sharpe ratio | Maximum drawdown (%) |
|---|---|---|---|---|---|
US | S&P 500 | 13.5 | 12.9 | 1.2 | 33.9 |
Europe | MSCI Europe ex-UK Index | 7.4 | 13.1 | 1.1 | 34.6 |
UK | FTSE 100 | 4.8 | 11.4 | 1.2 | 36.6 |
India | MSCI India Index | 11.0 | 13.6 | -0.1 | 37.6 |
Japan | MSCI Japan | 14.5 | 21.8 | 1.5 | 36.6 |
China | Shanghai Shenzhen CSI 300 | 3.3 | 17.8 | -0.1 | 49.6 |
Emerging Markets | MSCI Emerging Markets Index | 6.6 | 23.4 | 1.3 | 43.4 |
Source: August 2026, J.P. Morgan Personal Investing, Macrobond. Data in local-currency terms.
Scott Gardner, Investment Strategist at J.P. Morgan Personal Investing, explains:
“Developed markets often form the core of diversified equity portfolios. However, because returns and volatility can change over time, taking a long-term, globally diversified approach – one that’s aligned with your objectives, risk tolerance, and time horizon – can help you stay focused on your plan through different market environments.”
Regional valuation differences: what can P/E ratios tell investors?
Many investment platforms provide P/E ratios (price-to-earnings) for company shares or indices. Here we are focusing on historic P/Es, but forward P/E ratios are also used by investors.
P/Es are simple, widely used financial figures that show how much investors are paying for earnings, which is often used as an indicator of investor confidence. Like all financial ratios, P/Es should not be used in isolation to make investment decisions.
The simplicity of P/E ratios does however make them a common ‘starting point’ for investor analysis. Because P/Es can help provide an understanding of broader market enthusiasm or pessimism, investors can then perform their own research to determine what has created the difference in investor confidence.
For example, if ‘company A' has a higher P/E than a competitor – ‘company B’ – in the same sector, it might suggest that investor confidence in company A’s earnings growth or earnings quality (how reliable/consistent earnings have been) is higher. Investors can then determine why this might be, and if they agree.
When comparing investments in different geographies, P/Es may also reflect the market’s broad perception of the risk of investing in a region (i.e. are investors paying less where currency, political, or policy risk feels higher?).
An index’s sector composition, outlined above, can also influence the P/E ratio of an index overall.
For example, as the US market is currently more growth- and tech-heavy, it commonly trades on higher P/Es than the UK market, which has tended to have more weight in financials, energy, materials and consumer staples.
Europe and Japan each have their own sector mixes too. So when you see valuation gaps, they may reflect different industry exposures, not just greater confidence in one region than another.
They will also move over time. In the chart below you will see how the P/E ratios for major global indices have moved between 2020 and 2026, generally rising to a peak around 2020/2021, declining around 2023, before steadily rising to the end of the period.
Global equity indices – Historic P/E ratios
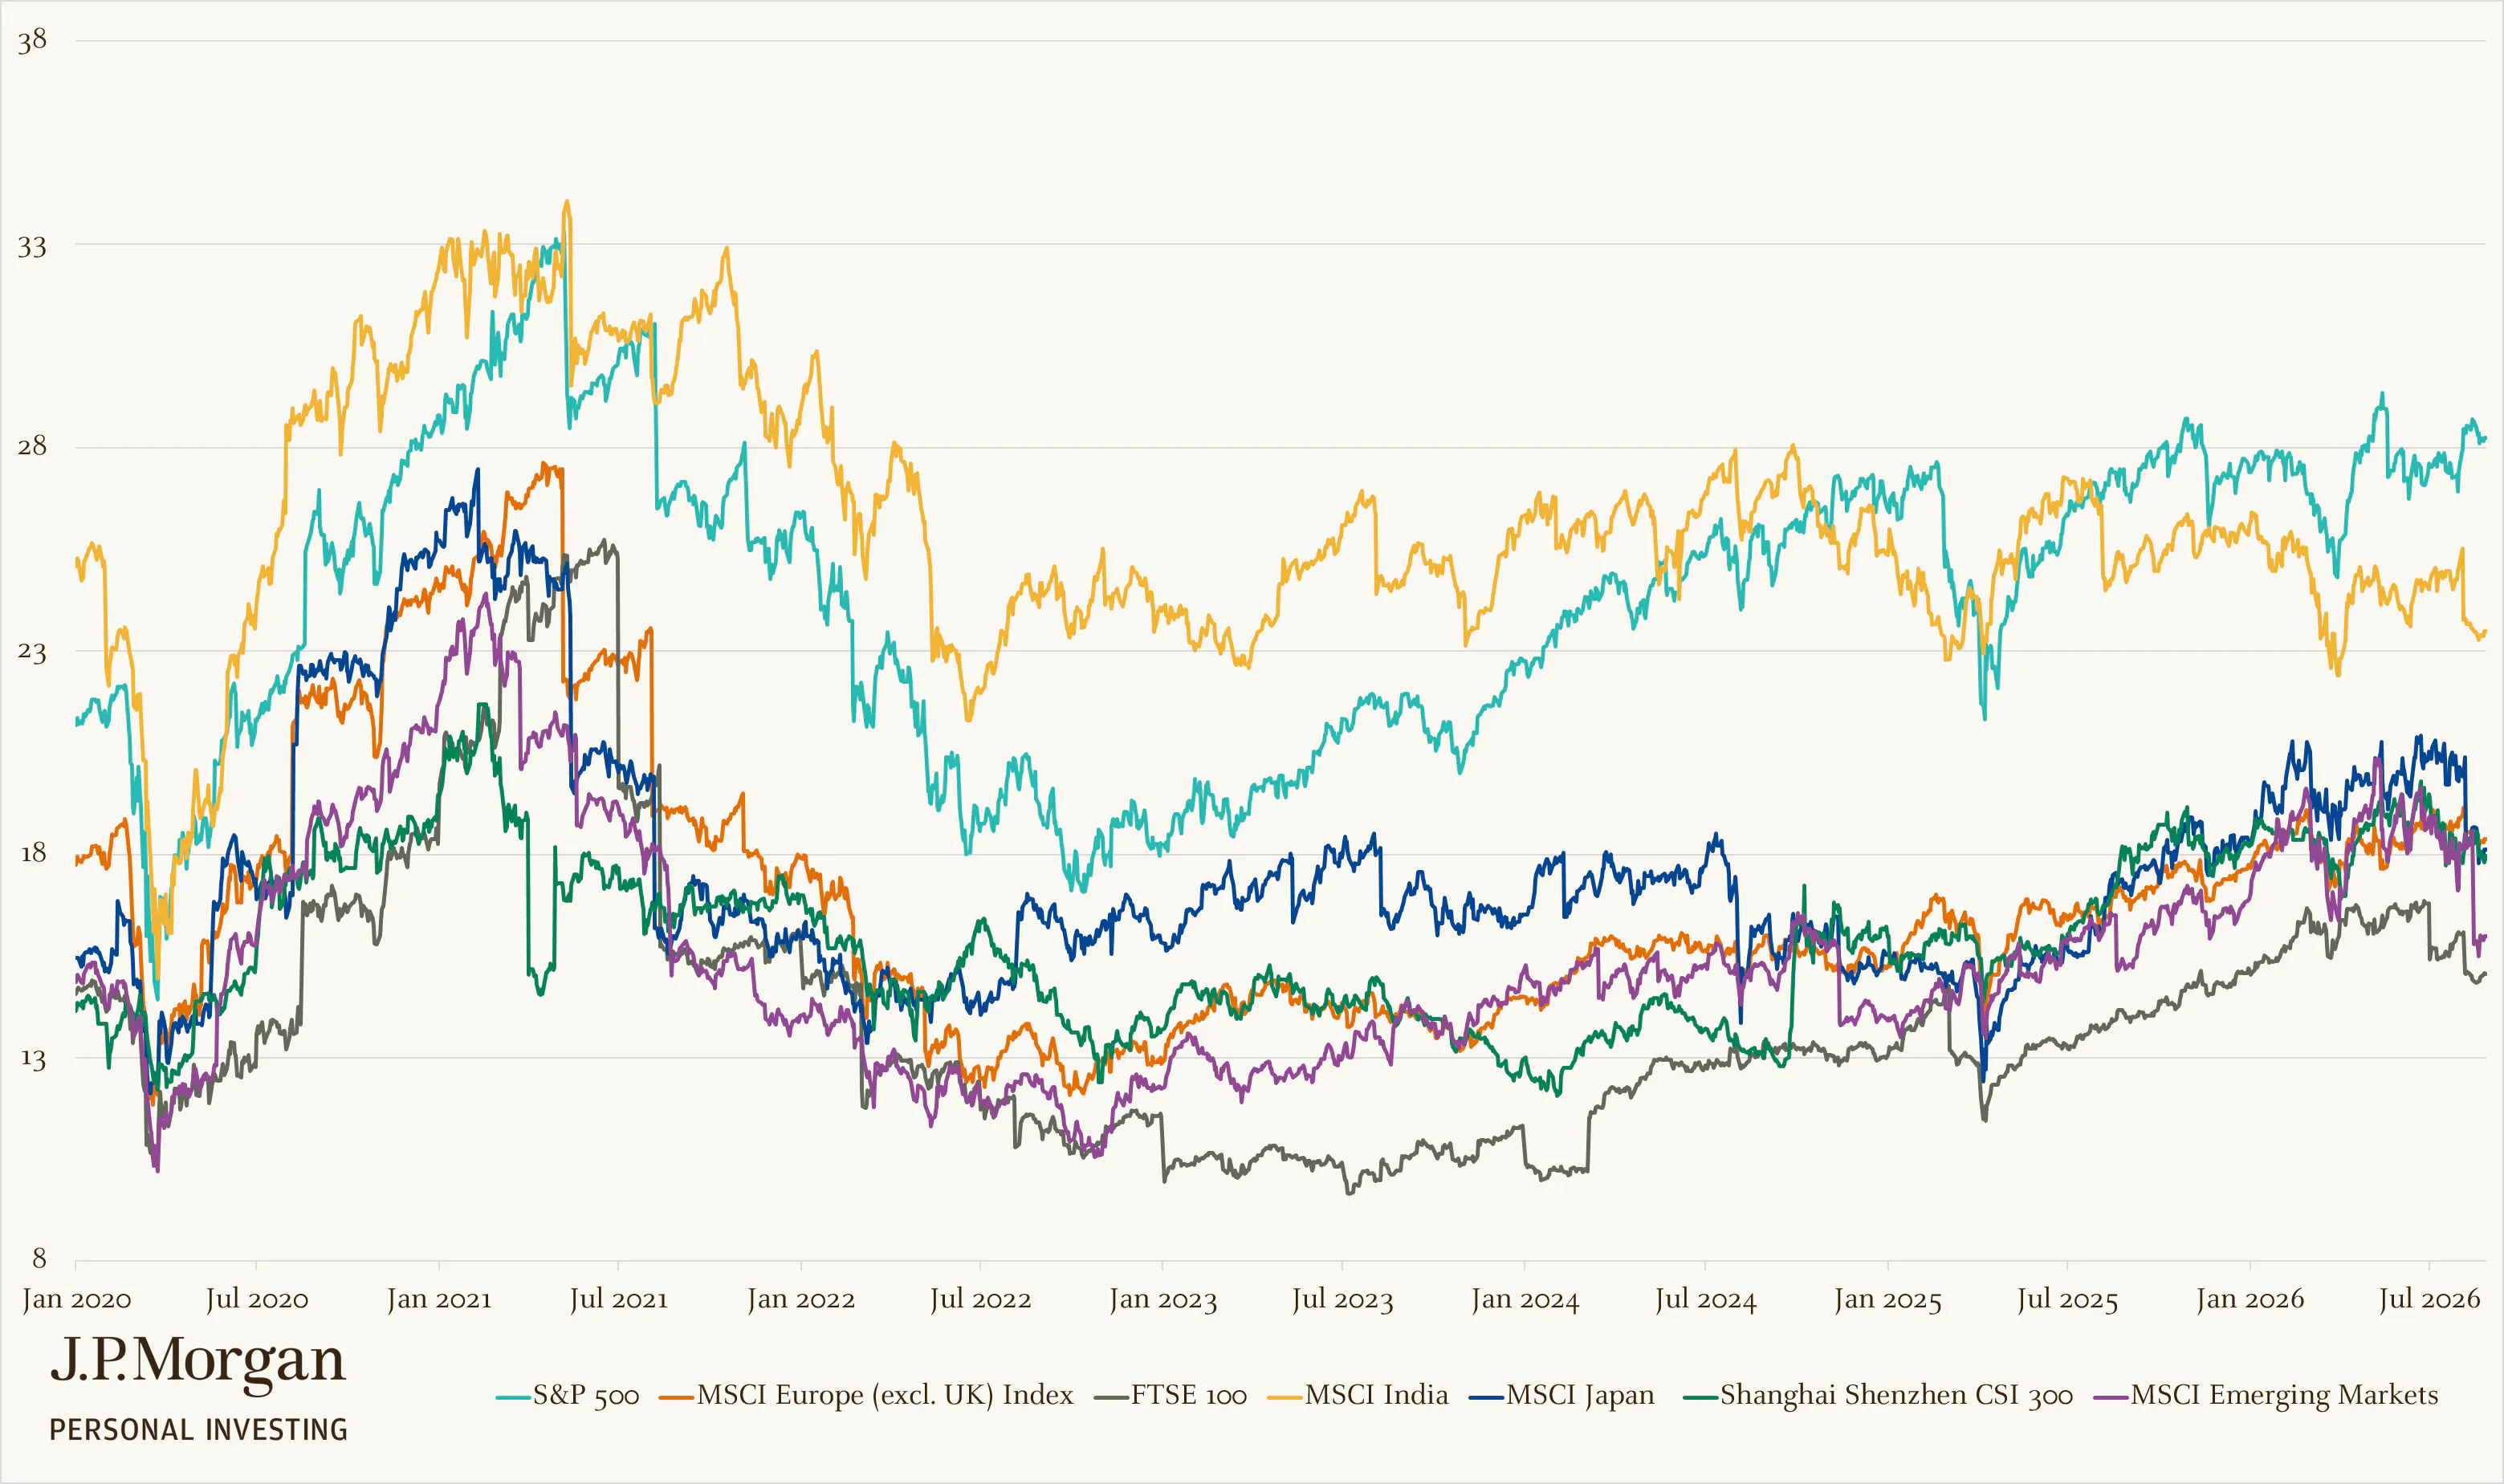
Source: J.P. Morgan Personal Investing, Macrobond, August 2026. Past performance is not a reliable indicator of future returns.
Where do companies actually do business?
Revenue exposure is a way for investors to understand where a company, or an index, earns its money. This is another consideration for investors, as ‘country' labels on indices that don’t always offer a full picture on where underlying business profits are made. For international investing, revenue exposure can change the risks you’re taking and alter the diversification you’re really getting.
A good example is a ‘domestic’ index that earns a large share of revenue overseas.
The FTSE 100 is often described as a UK equity index, but many of its biggest companies are multinational businesses that sell globally. That means the FTSE 100 can be less sensitive to the health of the UK consumer (and more sensitive to global growth, commodity prices, or currency moves) than investors might expect.
Around 25% of revenue for companies in the FTSE 100 comes from the UK, which is the same as revenue generated from the US. This compares with around 58% of revenue for S&P 500 companies generated domestically, and less than 3% from the UK.
The reverse can also happen: a ‘foreign’ allocation may still give you meaningful exposure to the US or Europe because many global companies outside the US earn a lot from American and European customers. So you might think you’re diversifying away from the US, but a chunk of the earnings can still be tied to US/European demand.
The takeaway: investing ‘in a country’ depends heavily on the index or instrument you choose (eg. ETF or fund). Before investing, look up the index’s sector weights, top holdings, and – if available – revenue-by-region breakdown. That small bit of research can help you match your international exposure to your actual goal.
Putting it all together: building a globally diversified portfolio
Global diversification is really about not letting any single country, currency, or market dominate your outcomes.
By spreading equity exposure across regions and paying attention to what’s inside each market (index construction, sector tilts, concentration, liquidity, and the policy/regulatory backdrop), you can make your portfolio more resilient. It can allow you to better align your portfolio to the risks you want to take, or offer a better understanding of the risks your portfolio might be affected by. Just as importantly, remember that a 'country' label doesn’t always tell you where companies earn their money, so revenue exposure and currency moves can change the diversification you’re getting.
Practical next steps for diversifying by region
- Review your current geographic split
- Check the top holdings and sector weights of any ETFs or funds you use
- Decide whether any single region is bigger than you’re comfortable with
- Check if your portfolio is underexposed to areas you would like to add
It’s generally advisable to make changes gradually; making regular contributions over time, and rebalancing in stages. Keep in mind that past performance can guide understanding, but it can’t predict what comes next.
Risk warning
The longer you stay invested, the more time your money has to grow. Investments go up and down, so at times you could get back less than you invest.
Past performance and forecasts are not a reliable indicator of future performance. We do not provide investment advice in this guide. Always do your own research.