Markets spring forward despite ongoing Middle East risks

Euan Jones
6 min

With a lasting de-escalation still eluding political leaders, tensions in the Middle East remain high. Despite this, financial markets have rallied strongly, with encouraging US corporate earnings pushing the S&P 500 index to a new all-time high.
At a glance
- Geopolitically, the prevailing theme in the Middle East is one of continued uncertainty and ‘noise’ for financial markets
- Despite the uncertain backdrop, financial markets have rallied around encouraging US corporate earnings figures for the first quarter of 2026
- Some equity indices have recovered from their March price falls to post record high levels in April
- Staying invested ensures that you have exposure to these periods where markets rally. Trying to ‘time the market’ can impact your long-term returns quite significantly.
Geopolitically, uncertainty in the Middle East remains the prevailing theme
While there have been some positive developments in the Middle East, the situation remains tense. Through talks on neutral territory in Pakistan earlier in the month, we have seen a temporary US-Iran ceasefire agreed and take effect in recent weeks. However, there have been reports of breaches of the ceasefire, and no permanent resolution has yet been agreed at time of writing.
For investors, a dominant issue is the flow of trade from the Persian Gulf, through the key trade route of the Strait of Hormuz and on to global shipping routes. There remains a lack of any real clarity surrounding the safe passage of ships in the region and this is stemming oil flows.
As a result, the global benchmark price for oil (Brent crude) continues to be elevated, hovering between around $90 and $110 per barrel over the course of April so far. This reflects the hit to global supply that the conflict has created, given that around 25% of the world’s seaborne oil trade transited through the Strait of Hormuz prior to the conflict, according to the International Energy Agency.
“While there have been various statements on potential next steps from each side, the prevailing theme is one of continued uncertainty and ‘noise’ for financial markets” comments Investment Strategist Scott Gardner.
Despite this, financial markets have rallied strongly
After experiencing significant falls in March, during which some equity indices dropped by over 10%, markets have been on the up. Many equity indices have recovered their losses and gone on to reach new all-time highs. For example, the S&P 500 – which reflects the performance of the 500 largest listed US companies – reached a new all-time high around the middle of the month.
“Markets often like to focus on certainty, what is known and new developments. Many markets fell in March due to uncertainty around oil supply, leading to higher oil prices which could then feed into higher inflation.” Gardner explains.
An inflation shock can negatively impact consumers’ ability to spend and can compress businesses’ margins. This can lead to a more muted outlook for companies and therefore a dip in share prices.
Regions outside the US have also seen strong recoveries in April. Emerging market (EM) equities, for example, have bounced back. They were hit hard at the start of the conflict due to concerns about their dependency on Middle Eastern oil (reports of Sri Lanka paying around $285 per barrel at one point) and the possibility of a sustained slowdown in economic activity. Emerging market countries such as South Korea and Taiwan are home to semiconductor companies that are playing a central role in the supply chain for artificial intelligence (AI) firms. While oil prices can be a significant influence on EM economies, especially with Asian countries being a major importer of oil from the Middle East, the region is also increasingly driven by tech-related developments.
While there is still instability in the Middle East, some time has passed and markets are adjusting to the situation. The conflict continues to provide the backdrop to the investment environment but moving into April has seen the start of the quarterly corporate earnings season in the US – a major mark in the calendar for market participants.
Earnings season – where public companies announce their quarterly financial results – has shown encouraging results. For the period January–March (Q1 2026), 88% of S&P 500 companies have reported higher earnings per share (EPS) than forecast, according to Factset*. The takeaway that markets have rallied around is that corporate earnings have been surprisingly robust over the start of the year.
You have to be invested to benefit from any potential market rallies
Something we noted in last month’s investor update was that a portfolio can experience a sizeable drop in value at some point during the year, yet will often still see positive full-year returns.
The maximum drawdown, commonly referred to as the ‘max drawdown’ is the change in a portfolio’s value from its highest point (peak) to its lowest (trough) over the course of a set period of time.
During times when markets are seeing sharp falls in asset prices, like we saw in March, it can be tempting to seek out ‘safety’ by moving part or all of a portfolio into cash or lower risk investments. However, as we have seen in April so far, a market rally can follow swiftly.
Staying invested ensures that you have exposure to these periods where markets rally. Trying to ‘time the market’ can impact your long-term returns quite significantly.
The below chart shows annual returns (bars) for the S&P 500 index since 1980, as well as the ‘max drawdown’ each year (dots), also referred to as the intra-year decline.
There are many notable contrasts where the intra-year decline is significant but the full-year returns are positive. For example: in 2025 (intra-year decline of -19%, but full-year returns of +16%), or in 2019 (-7%, +29%).
This supports the fact that volatility is a feature of investing in financial markets and not a bug. The S&P 500 has closed out 35 of the 46 years shown with positive returns, supporting the strategy of staying the course.
S&P 500 intra-year declines vs. calendar year returns
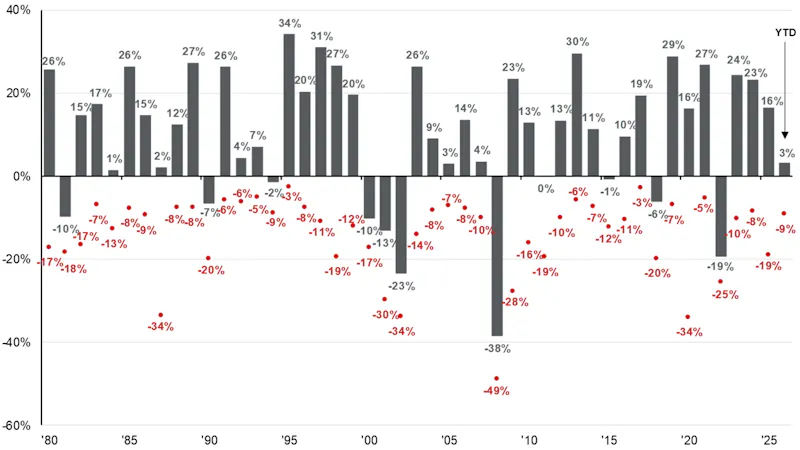
Source: FactSet, Standard & Poor’s, J.P. Morgan Asset Management Guide to the Markets. Returns are based on price index only and do not include dividends. Intra-year drops refers to the largest peak-to-trough decline during the year. Returns shown are calendar year returns from 1980 to 2025, over which the average annual return was 10.7%. These figures refer to past performance, which isn’t a reliable indicator of future performance. Data as at 21 April 2026.
Talk to us
If you would like to discuss any of the themes covered in this article, or have questions regarding your investment portfolio, you can book a call with one of our wealth experts.
*Source: Factset Earnings Insight, 17 April 2026
Risk warning
As with all investing, your capital is at risk. The value of your portfolio can go down or up and you may get back less than you invest. Past performance and forecasts are not reliable indicators of future performance. We do not provide investment advice in this article. Always do your own research.